Chapter 9 Data Handling 9.4
Question 1: A survey of 120 school students was done to find which activity they prefer to do in their free time.
Which activity is preferred by most of the students other than playing?
Answer:

Question 2: The number of Mathematics books sold by a shopkeeper on six consecutive days is shown below:

Answer:

Question 3: Following table shows the number of bicycles manufactured in a factory during the years 1998 to 2002. Illustrate this data using a bar graph. Choose a scale of your choice.
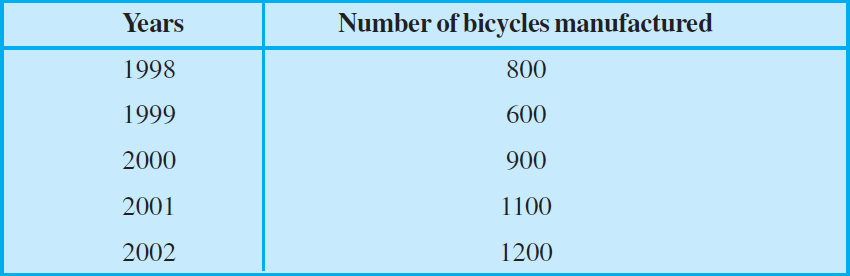
b) In which year were the minimum number of bicycles manufactured?
Answer:

b) In 1999, the minimum number of bicycles manufactured.
No comments:
Post a Comment